Assist Streamlit mode for data scientists
Streamlit is a Python framework that turns scripts into interactive web apps. It serves data scientists, machine learning engineers, and analysts who want to create and share rich visualizations without touching HTML, CSS, or JavaScript.
With just a few lines of code, you can add sliders, dropdowns, charts, and text inputs that react in real-time as your users interact with the app.
While Streamlit simplifies the process of building interactive visuals, DataOps.live Assist further enhances the experience by automatically generating Streamlit apps from plain English prompts. Let’s see this in action.
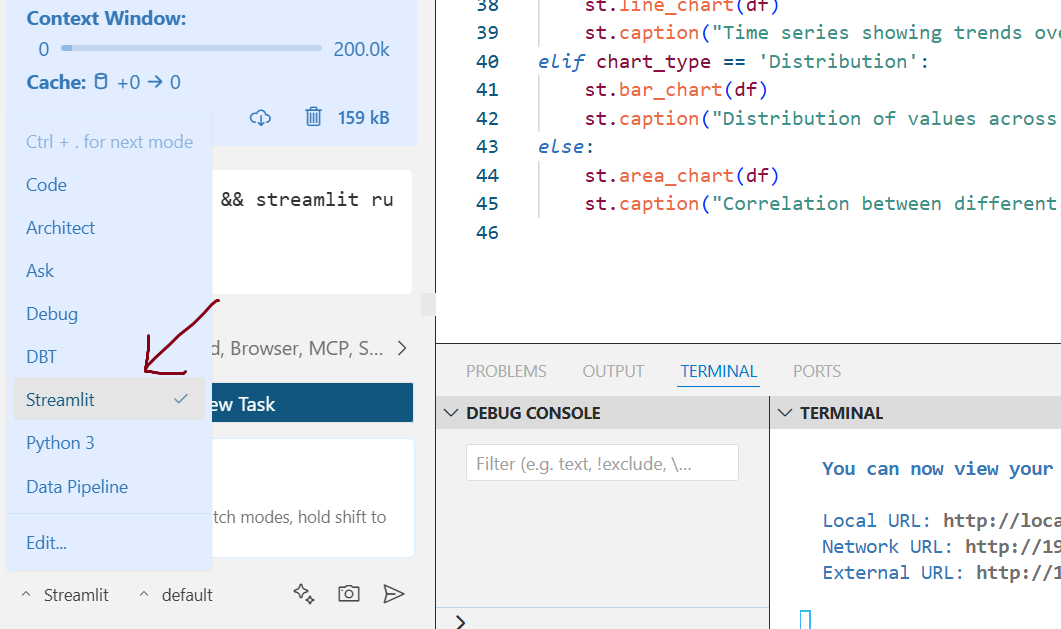
First, select Streamlit mode from here:
When you prompt Assist in Streamlit mode: "Create a simple Streamlit app and run it", it first runs pip install streamlit. This step ensures that Streamlit is available in the environment.
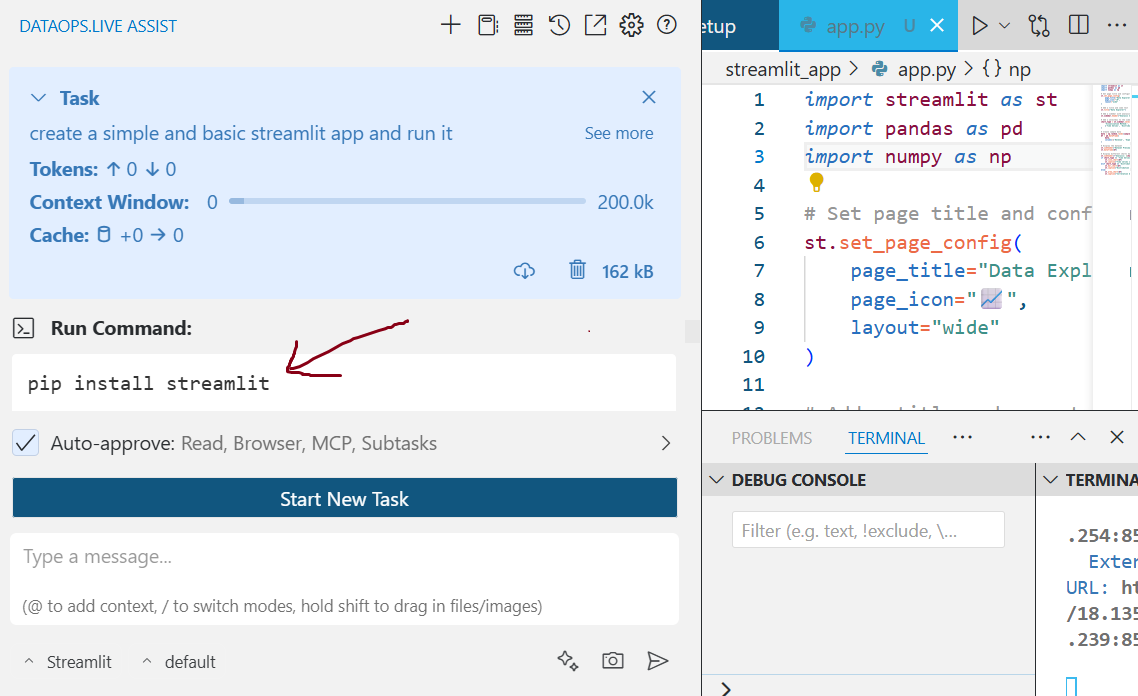
Then, Assist creates a new file called app.py and generates the following code inside it:
import streamlit as st
import pandas as pd
import numpy as np
# Set page title and configuration
st.set_page_config(
page_title="Data Explorer",
page_icon="📈",
layout="wide"
)
# Add a title and some text
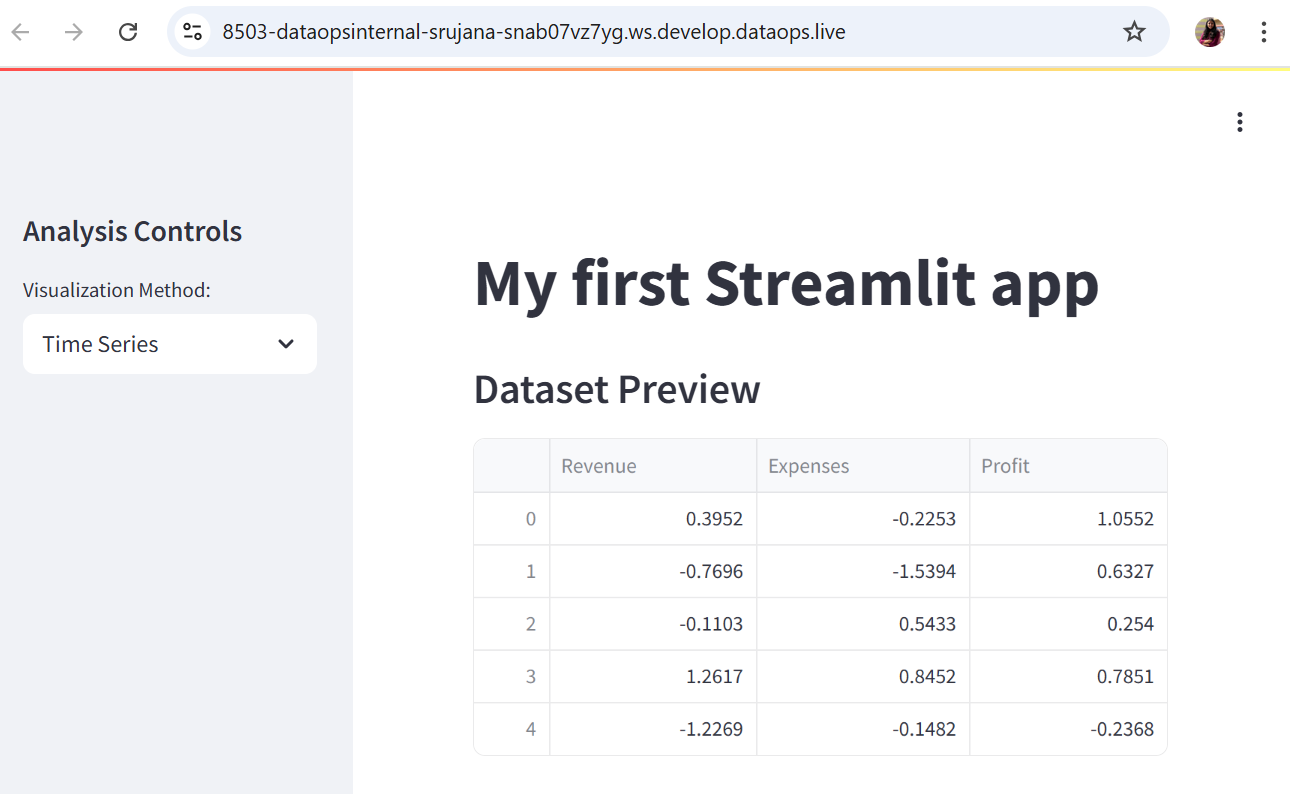
st.title("Data Explorer")
# Add a sidebar with analysis controls
st.sidebar.header("Analysis Controls")
# Add a selectbox to the sidebar
chart_type = st.sidebar.selectbox(
'Visualization Method:',
['Time Series', 'Distribution', 'Correlation']
)
# Create sample data
data = np.random.randn(sample_size, 3)
df = pd.DataFrame(
data,
columns=['Revenue', 'Expenses', 'Profit']
)
# Display the dataset
st.subheader("Dataset Preview")
st.dataframe(df)
# Display different charts based on selection
st.subheader(f"Analysis: {chart_type}")
if chart_type == 'Time Series':
st.line_chart(df)
st.caption("Time series showing trends over time")
elif chart_type == 'Distribution':
st.bar_chart(df)
st.caption("Distribution of values across categories")
else:
st.area_chart(df)
st.caption("Correlation between different metrics")
Finally, it runs the command: streamlit run app.py
You'll now see a local URL displayed in the terminal. Clicking on the URL will open the web app in your browser.
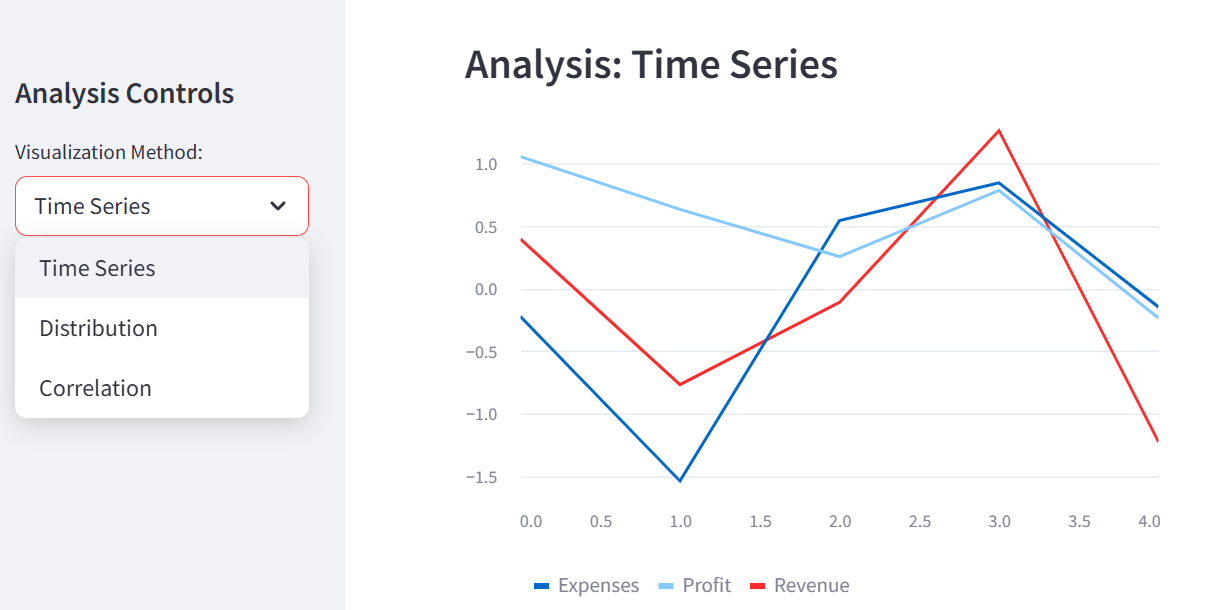
You select the type of visualization you want to see: time series, distribution, or correlation. Based on what you choose, the app shows the corresponding chart, either a line chart, bar chart, or area chart.