Column Lineage
The Column Lineage tab provides a visual representation of how data flows through a Data Product. It shows relationships between source data, models, and downstream Data Products, helping users understand how data is transformed and consumed.
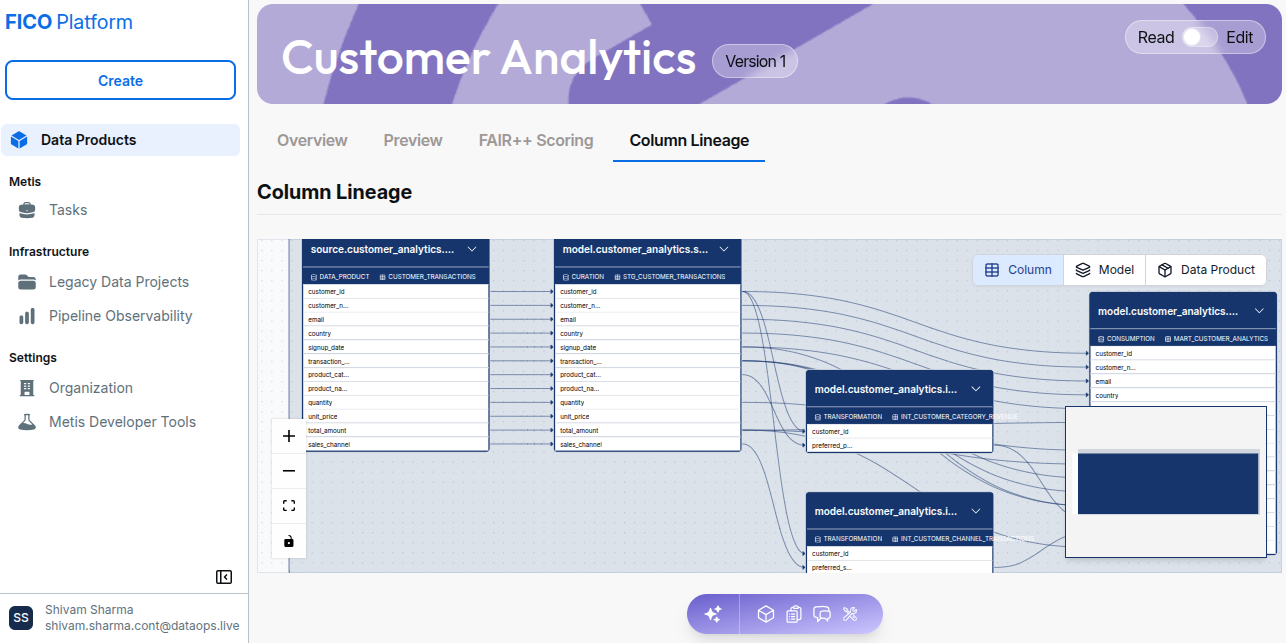
Lineage Views
The lineage visualization provides three levels of detail:
- Column – Displays relationships between individual columns.
- Model – Displays relationships between models.
- Data Product – Displays relationships between Data Products.
You can switch between these views using the controls in the upper-right corner of the lineage visualization.
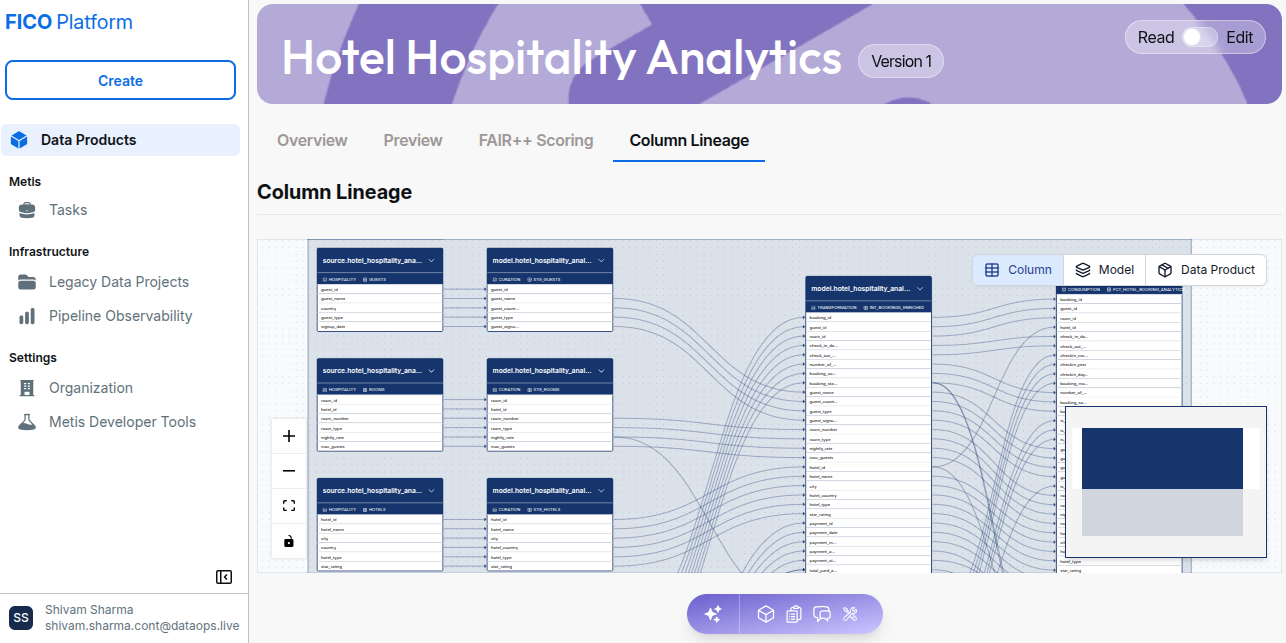
Column View
The Column view provides the most detailed level of lineage. It displays individual columns within data assets and shows how columns are connected across the lineage graph.
This view can be used to understand:
- Which source columns contribute to downstream columns.
- How columns flow between models.
- How individual fields are transformed across the Data Product.
- Dependencies between upstream and downstream columns.
Model View
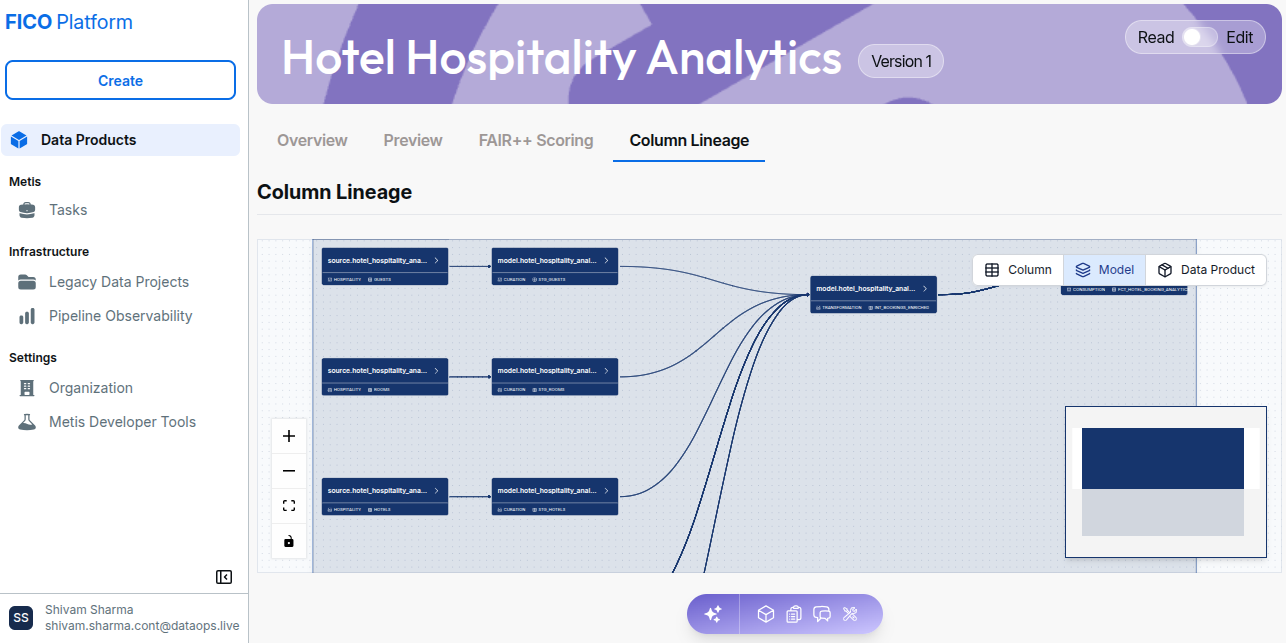
The Model view provides a higher-level representation of lineage by displaying relationships between models rather than individual columns.
This view makes it easier to understand the overall transformation flow without the additional detail of individual columns.
Data Product View
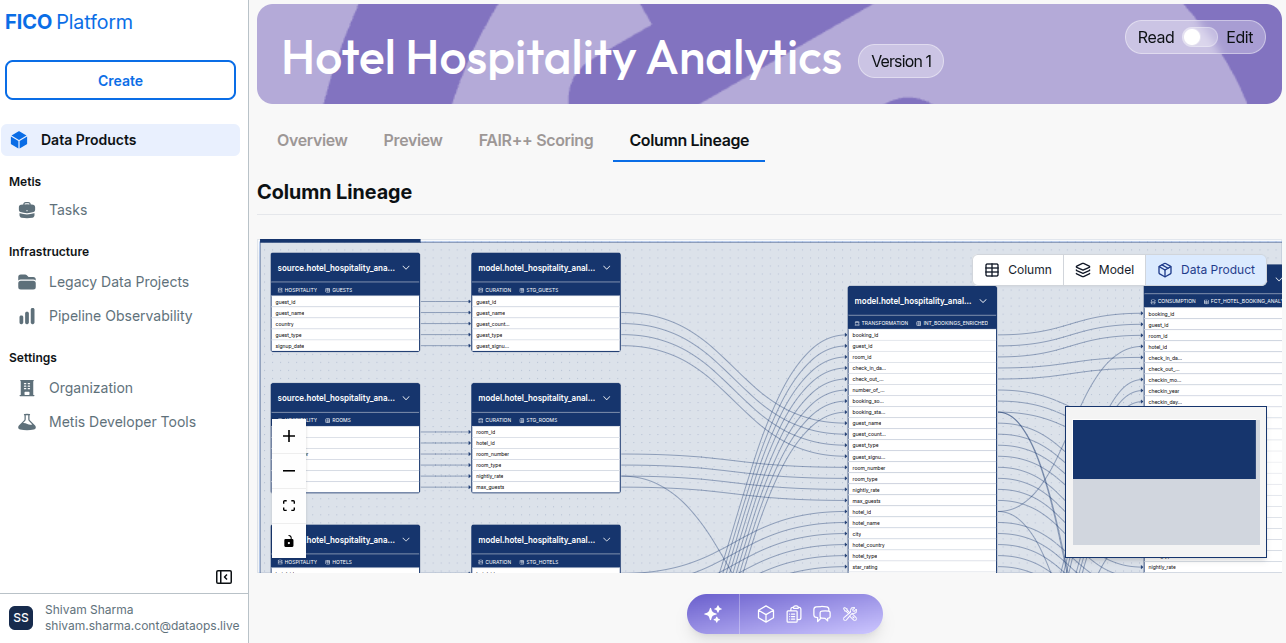
The Data Product view provides a high-level view of the Data Products involved in the lineage.
This view helps users understand how the selected Data Product relates to other Data Products in the lineage.
Understanding Lineage Relationships
The lineage graph represents relationships using connected nodes and lines.
Depending on the selected view:
| View | Displays |
|---|---|
| Column | Individual columns and their lineage relationships |
| Model | Models and their transformation relationships |
| Data Product | Data Products and their dependencies |
The level of detail shown in the graph changes based on the selected view, allowing you to move from a detailed column-level view to a higher-level understanding of model and Data Product relationships.