Preview
The Preview tab provides users with a view of the data produced by a Data Product.
It allows users to inspect the available tables, understand the structure of the data, and review the available test results before using or modifying the Data Product.
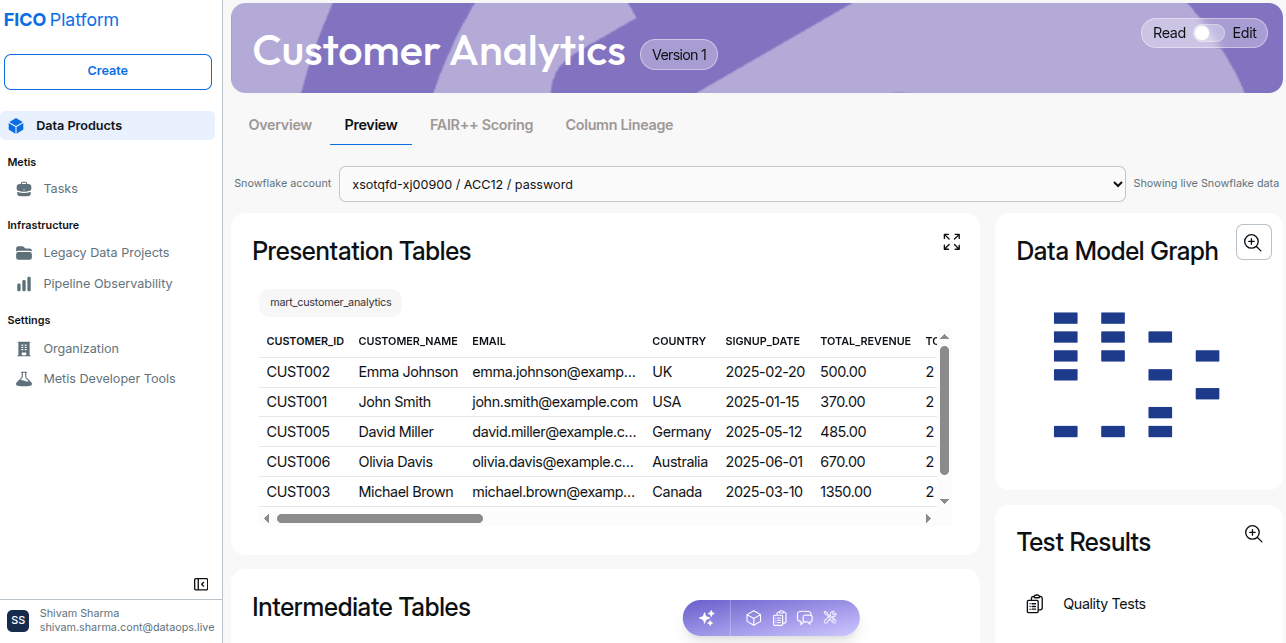
Presentation Tables
The Presentation Tables section displays the primary data outputs of the Data Product.
Users can inspect the available columns and sample records directly within the Data Product Preview.
The displayed information may include:
- Column names
- Data values
- Data types
- Column-level metadata
- Data records
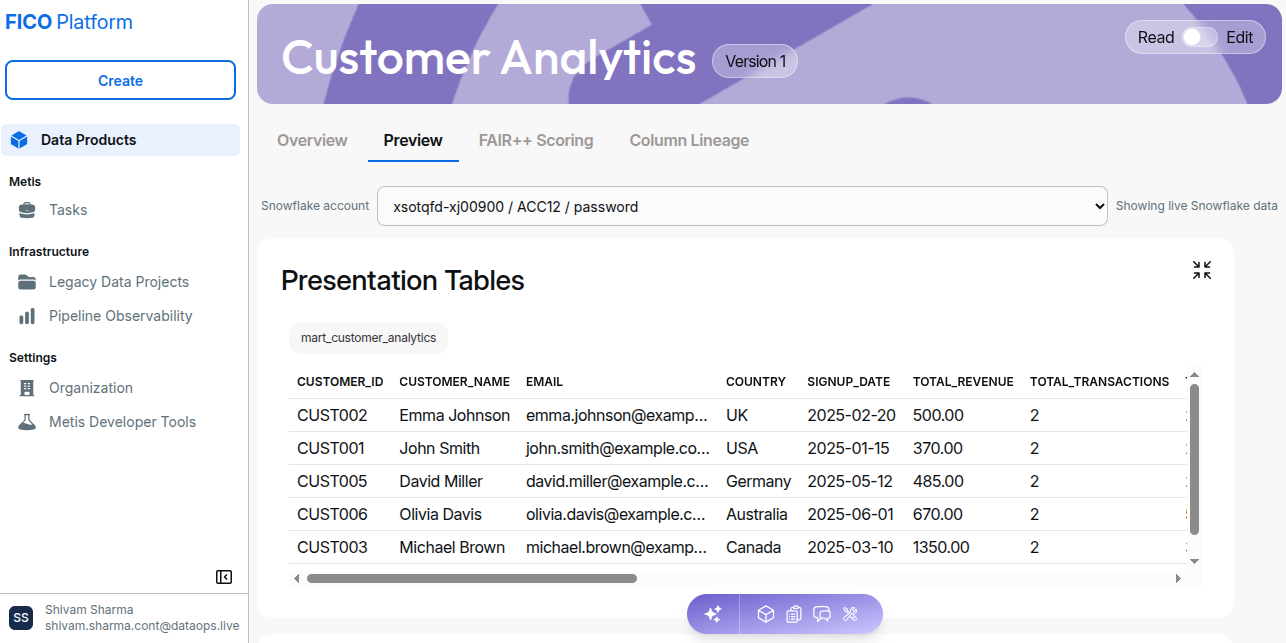
This provides users with a quick way to understand the data exposed by the Data Product.
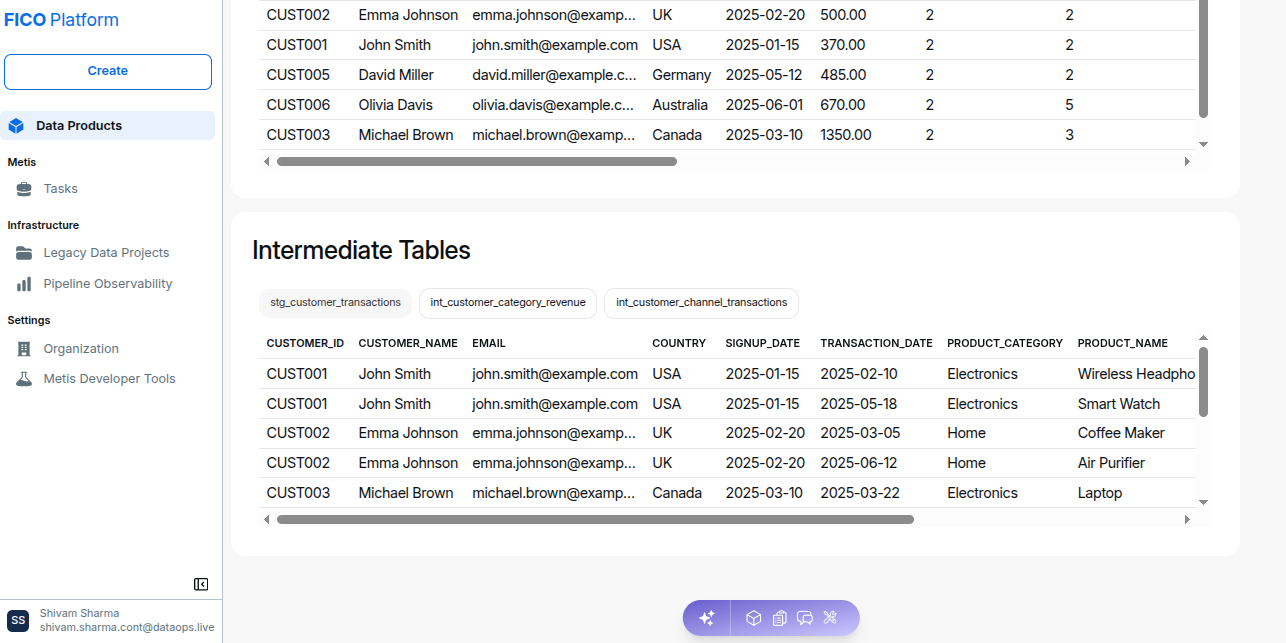
Intermediate Tables
The Intermediate Tables section displays intermediate models used as part of the Data Product when they are available.
Intermediate models can help users understand the processing layers behind the final presentation data.
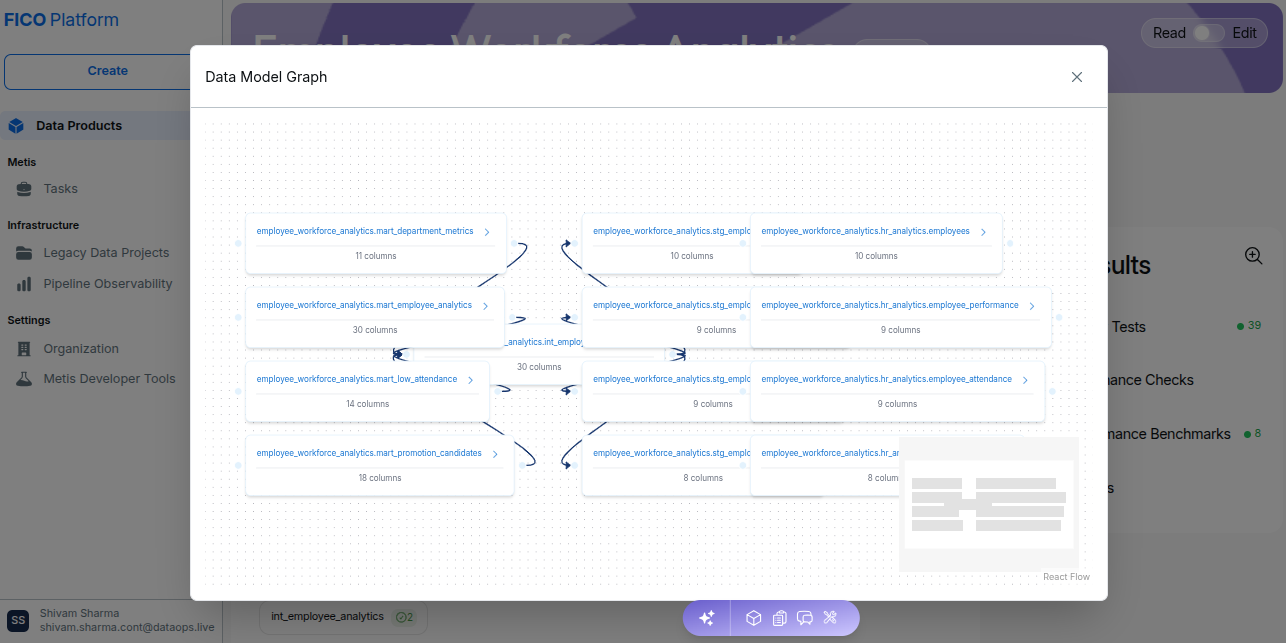
Data Model Graph
The Data Model Graph provides a visual representation of relationships between the models that make up the Data Product.
It can be used to understand how the different data models are connected.
Test Results
The Test Results section provides an overview of the tests associated with the Data Product.
The available test categories may include:
- Quality Tests
- Governance Checks
- Performance Benchmarks
- AI Tests
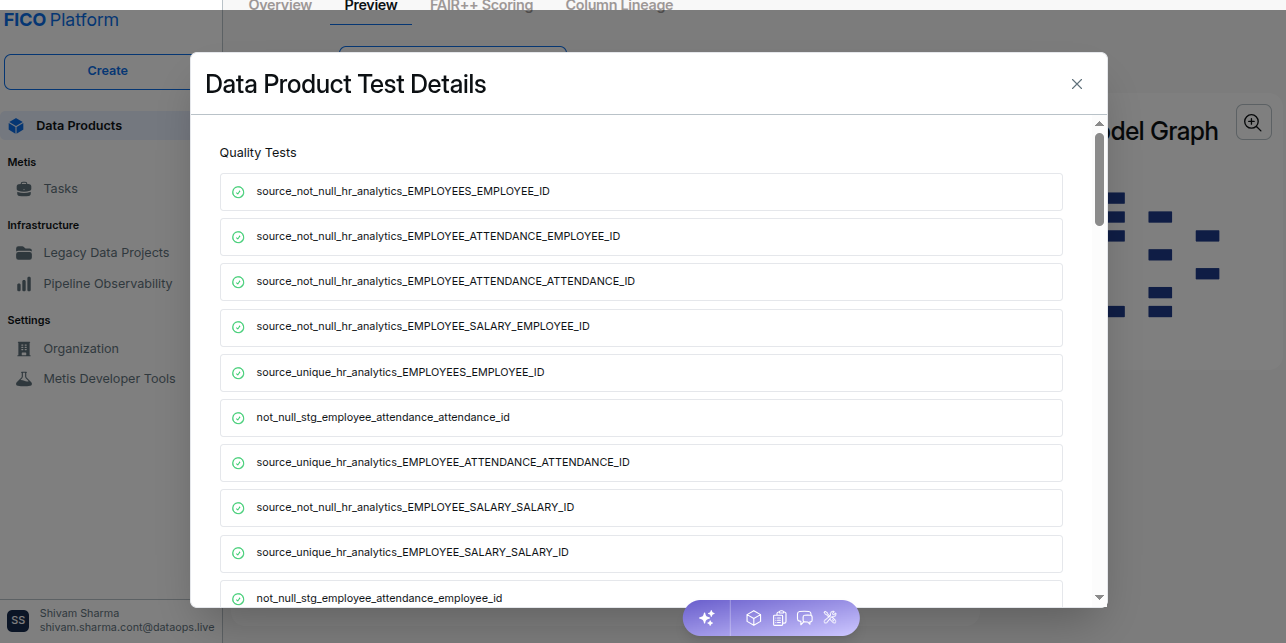
The displayed count indicates the number of tests or checks available for each category.
These results help users understand the quality and operational characteristics of the Data Product.