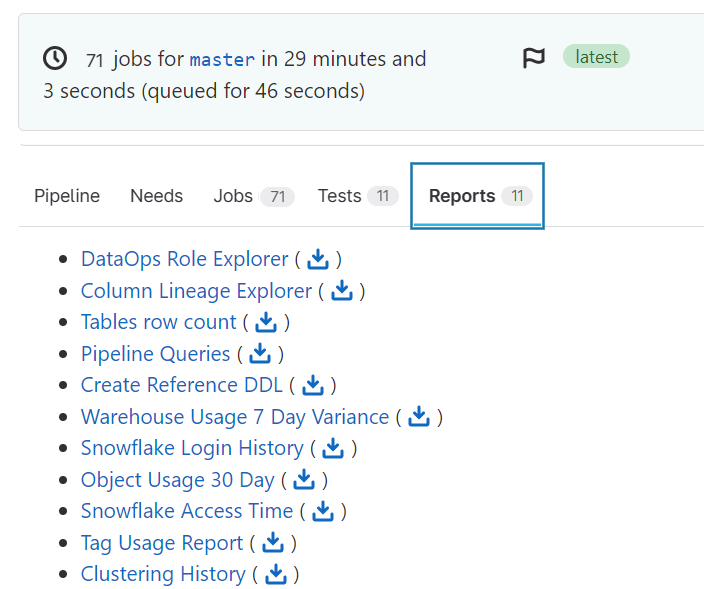
Reports
DataOps.live reports are a special type of Job Artifacts that consist of a static web page rooted by an index.html file. Typically, you use these to provide reports about the pipeline execution. This can include pipeline statistics, the Snowflake query history or your custom report. There are many ways to generate such a basic HTML page to a react application.
All the generated reports of a pipeline are accessible from its summary page once the pipeline is completed:
Creating pipeline reports
You can create reports in any DataOps job by doing three things:
-
Ensure your job generates artifacts as shown in the section job artifacts.
-
Add the
expose_askeyword to the artifacts definition with the valueDataOpsReport.The value is case insensitive, thus
DataOpsReportordataopsreportare all acceptable values -
Ensure the root folder containing the artifacts has an
index.htmlfile.
Therefore a minimum artifacts section of the report creation job:
My Report:
  ...
  artifacts:
    name: "DataOps Report"
    paths:
      - index.html
    expose_as: "DataOpsReport"
Whatever name you set for the artifacts is the name displayed on the reports tab. Setting expose_as: "DataOpsReport" is mandatory.
How you create the index.html is up to your creativity. A hello world example looks like this:
My Report:
  extends:
    - .agent_tag
  image: $DATAOPS_UTILS_RUNNER_IMAGE
  script:
    - echo "Running job My Report"
    - touch index.html
    - echo "Hello World" > index.html
  artifacts:
    name: "DataOps Report"
    paths:
      - index.html
    expose_as: "DataOpsReport"
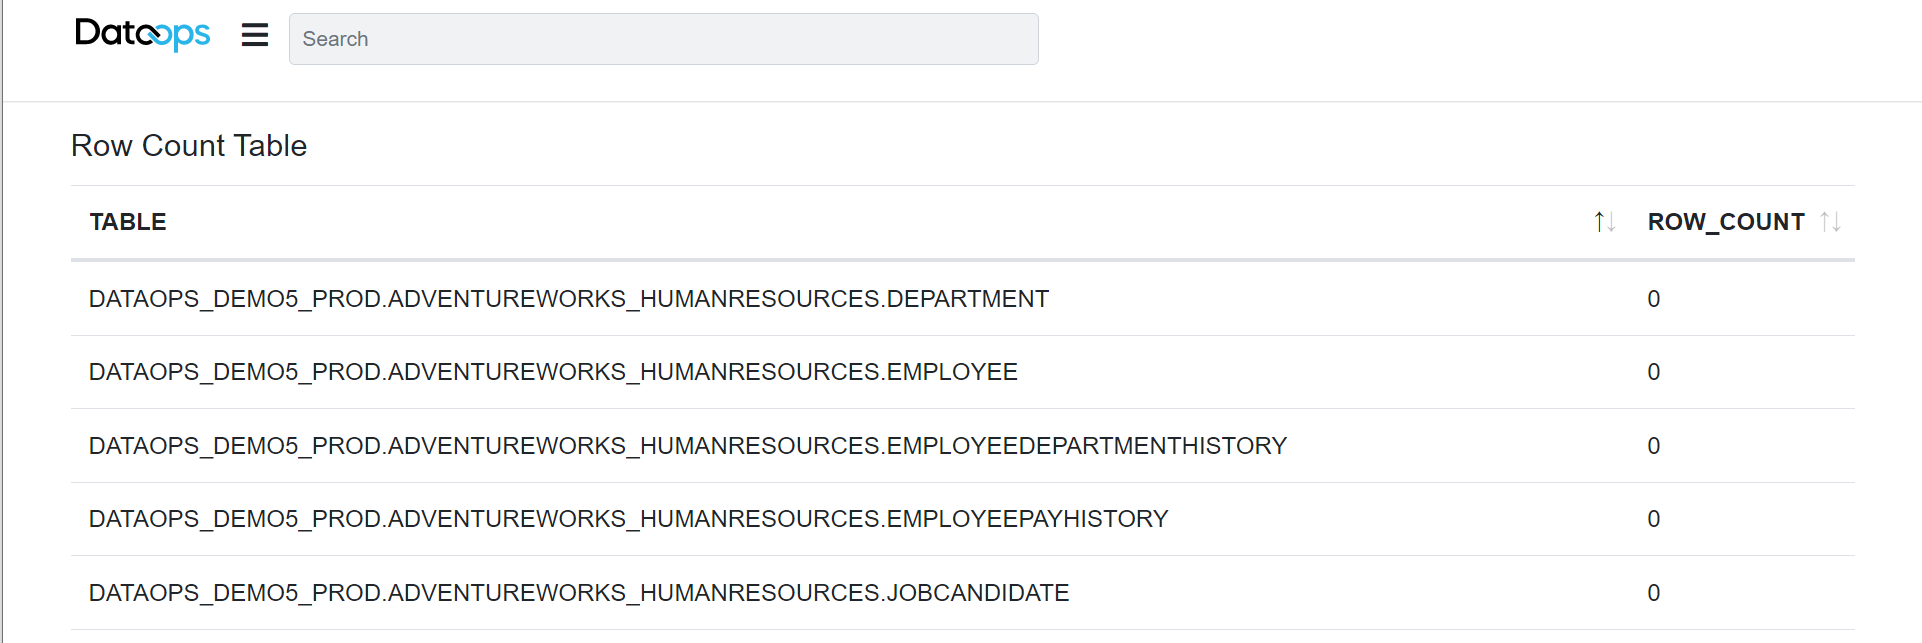
Example: Row count report
In this concrete scenario, a job using the Reporting Orchestrator runs the following SQL statement to gather the row count of all tables in all schemas of a database. It uses template rendering to inject the current branch's database from DATAOPS_DATABASE. Running the SQL produces a CSV output. This CSV then gets injected as the data into a prebuild DataOps static application rendering CSV as HTML.
The SQL query for the report:
SELECT table_catalog
       || '.'
       || table_schema
       || '.'
       || table_name AS "TABLE",
       row_count
FROM   "{{ env.DATAOPS_DATABASE }}".information_schema.tables
WHERE  table_type = 'BASE TABLE'
The reporting job:
"Render Row Count Report":
  extends:
    - .agent_tag
  stage: "Render Report"
  image: $DATAOPS_REPORTING_RUNNER_IMAGE
  variables:
    ...
    DATAOPS_REPORTER_RUN_SCRIPT: /snowflake-utils/execute_query
    DATAOPS_REPORTER_SNOWFLAKE_RUN_QUERY: $CI_PROJECT_DIR/dataops/generic_reporter/get_row_count.sql
    ...
    DATAOPS_REPORTER_RENDER_SCRIPT: /render-utils/csv_to_html
  script:
    - /dataops
  artifacts:
    name: "Tables row count"
    when: always
    paths:
      - $CI_PROJECT_DIR/dataops/reports
    expose_as: DataOpsReport
  icon: ${REPORT_ICON}
The script /snowflake-utils/execute_query specified in DATAOPS_REPORTER_RUN_SCRIPT executes the SQL query and places the generated CSV into $CI_PROJECT_DIR/dataops/reports. The render script /render-utils/csv_to_html specified in parameter DATAOPS_REPORTER_RENDER_SCRIPT also places a prebuild static web application into $CI_PROJECT_DIR/dataops/reports. The result is a merged application that has a $CI_PROJECT_DIR/dataops/reports/index.html file as required by DataOps Reports.
A sample report looks like this: