Compute Activity and Spend Summary
Spendview for Snowflake, the free module from DataOps.live observability, generates granular insights from the operational metadata of the activity and spending of one or more Snowflake accounts. It lets you monitor the spend drivers of specific Snowflake accounts from a centralized view.
Accessing Spendview for Snowflake
Ensure that you have added the Snowflake accounts you want to monitor to the Snowflake Accounts page in Spendview for Snowflake.
- Open Spendview for Snowflake in your browser.
- Enter your username and password in the open form and click Sign in.
- On the menu bar, click Compute to open a centralized view of the Snowflake accounts' spending and utilization.
Your access to the icons on the left sidebar depends on your role in Spendview. See Access levels and roles for more information.
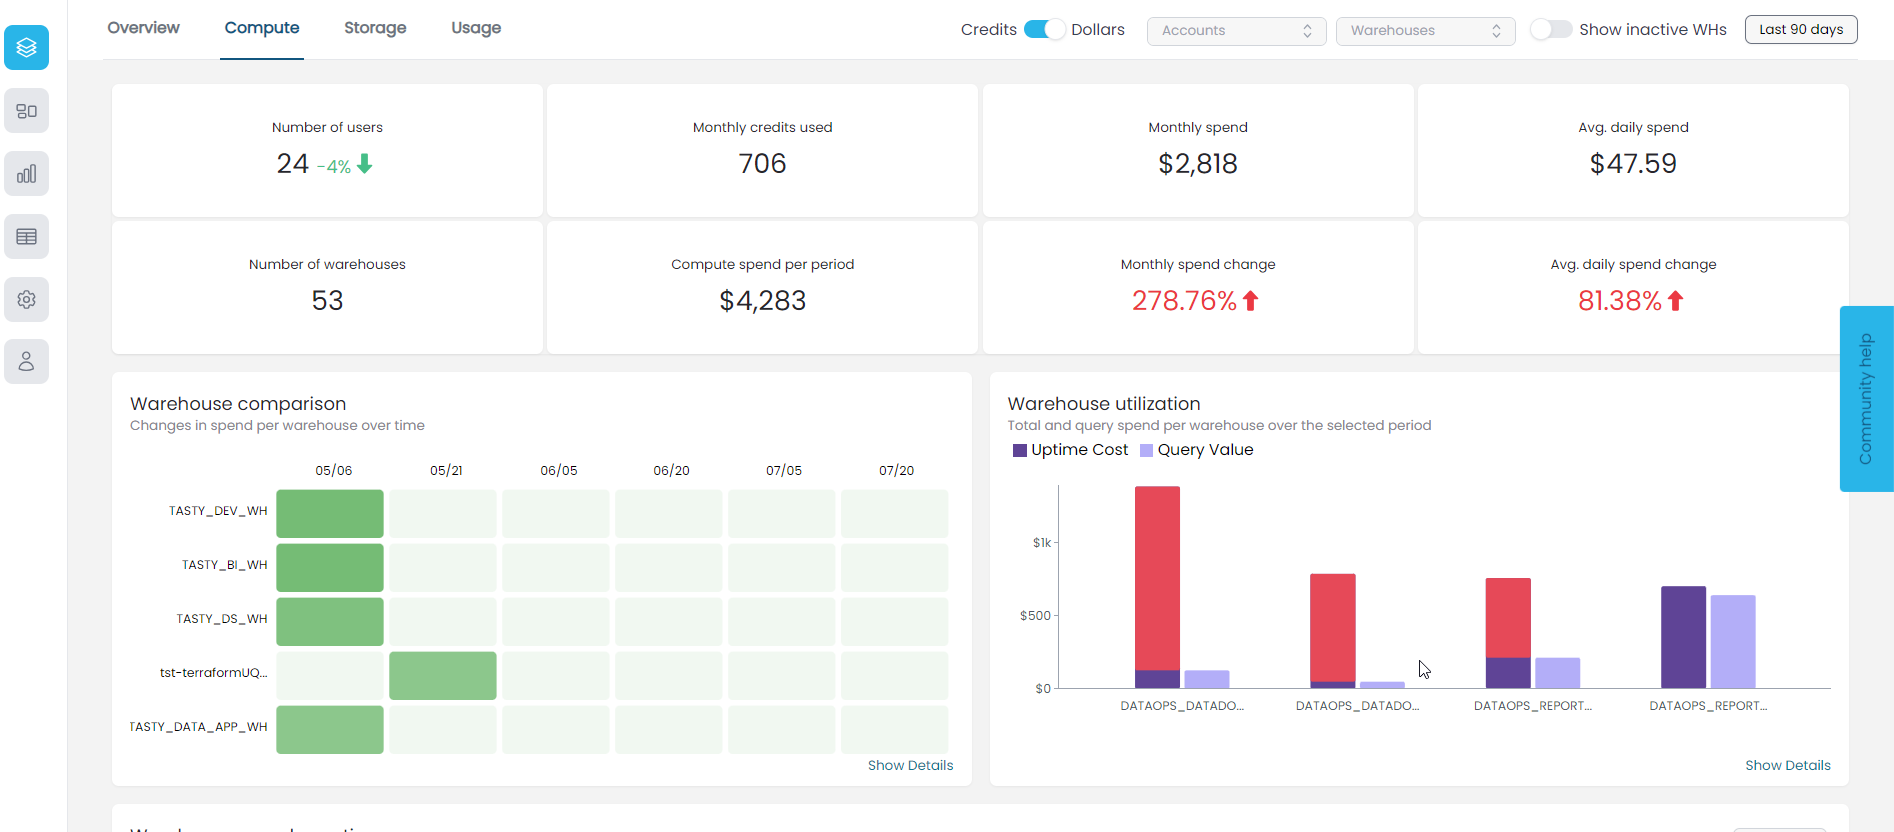
Overview
From the Compute page, you can visualize and analyze several graphical metadata representations about the selected Snowflake accounts and drill down into operational cost-driver issues in seconds.
Use the fields on the top right to choose the time- and account-specific visualization options:
- To look at the compute cost of specific Snowflake accounts, click in the Account field and select the accounts you want to monitor. Click Clear selection at the bottom of the list to remove your filter.
- To look at the compute cost of specific warehouses in the selected accounts, click in the Warehouses field and select the warehouses you want to monitor. Click Clear selection at the bottom of the list to remove your filter.
- To look at the compute cost during a specific date and time range, click in the date field and select the period you want to monitor.
- To show or hide all static warehouses in the selected accounts, toggle the Show inactive WHs option on or off.
Toggle on or off Credits or Dollars to show the credit score trends or the dollar score trends in the compute metrics.
In the overall compute summary metrics, you can learn about the following:
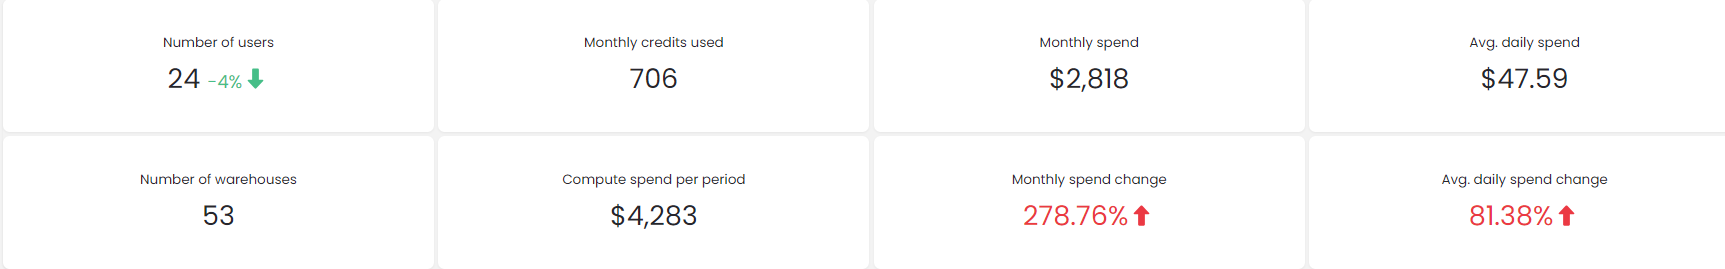
The percentage changes in the metrics will be red if the spend has increased and green if the spend has decreased. To get this rate, subtract the first period's spend — a month or a different period — from the second period's spend and divide that by the last spend's total. Multiply the result by 100, and you have the percentage.
| Name | Description |
|---|---|
| Numbers of users | Number of all users who have used the selected accounts over the chosen period |
| Number of warehouses | Number of warehouses used by the selected accounts over the chosen period |
| Monthly credits used | Last 30 days credits spent across the warehouses in the selected accounts |
| Compute spend per period | Dollars or credits spent across the warehouses in the selected accounts over the chosen period |
| Monthly spend | Dollars or credits spent across the warehouses in the selected accounts over the last 30 days |
| Monthly spend change | Cost percentage change — increase or decrease — between the last 30 days and the equal previous period |
| Avg. daily spend | Average dollars or credits spent per day across the selected account billed over the chosen period (compute cost divided by the days set in the date field) |
| Avg. daily spend change | Cost percentage change — increase or decrease — between the last 7 days and the equal previous period |
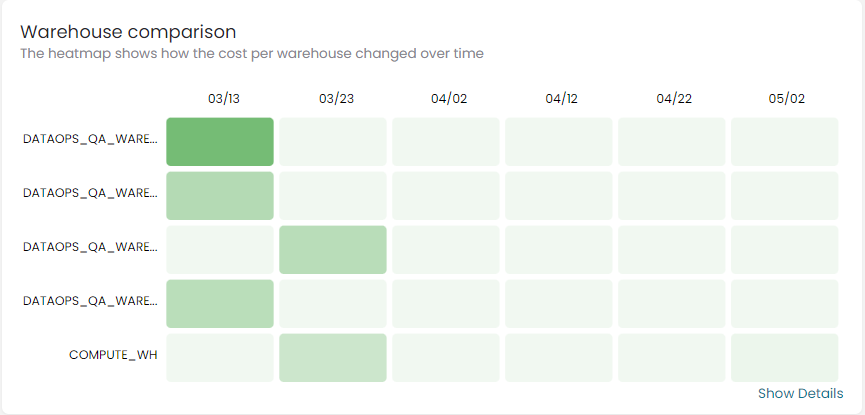
Warehouse comparison
This graphical representation of metadata uses color coding to show how spend per warehouse changes over the time specified in the date field on the top right of the page. This visual analysis makes it much easier to analyze warehouse spend at a glance.
- Point to a specific date on the heatmap to display the warehouse spend at that specific date.
- Click Show Details on the bottom right to open more details listing compute overview for the selected accounts.
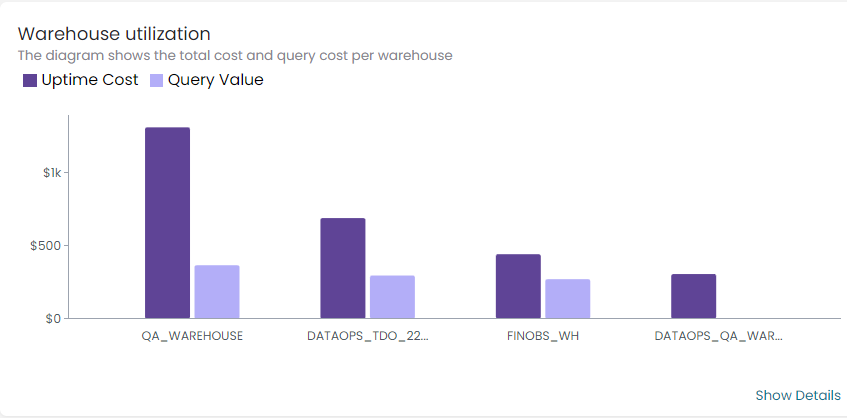
Warehouse utilization
This bar chart shows total and query spend per warehouse in the selected accounts and over the period chosen. It has two bars with color codes, one shows the actual spend per warehouse, and the other is the estimated spend based on the runtime of all the queries on the warehouse.
-
On the top right, select whether to show the compute or cumulative cost. Cumulative cost is based on costs already incurred by a warehouse and the planned costs for the remaining work/queries.
-
Point to each bar to display the total or query cost details.
There is nothing to worry about if both bars have equal sizes. If the query workload runs infrequently, the query cost becomes vastly less than the total cost. This indicates a usage problem where you must reduce your cost.
Check if you have permission to lower the auto-suspend value set on the warehouse. Otherwise, you may want to change to a smaller size that is more appropriate for the workload.
-
Click Show Details on the bottom right to open more details listing compute overview for the selected accounts.
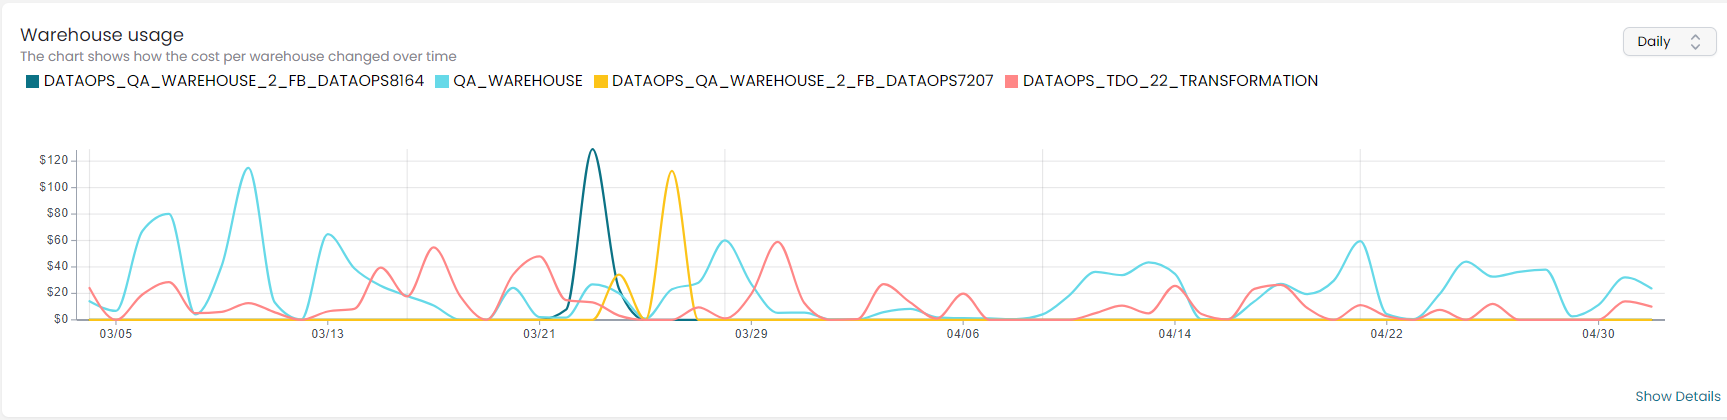
Warehouse usage
This line chart uses color codes to show how spend per warehouse changes over the time specified in the date field on the top right of the page. This visual analysis makes it much easier to analyze warehouse usage at a glance.
- On the top right, select whether to show the spend evolution per week, day, or month.
- Point to a specific warehouse/color on the line chart to display the warehouse name and the spend at a particular date.
- Click Show Details on the bottom right to open more details listing compute overview for the selected accounts.
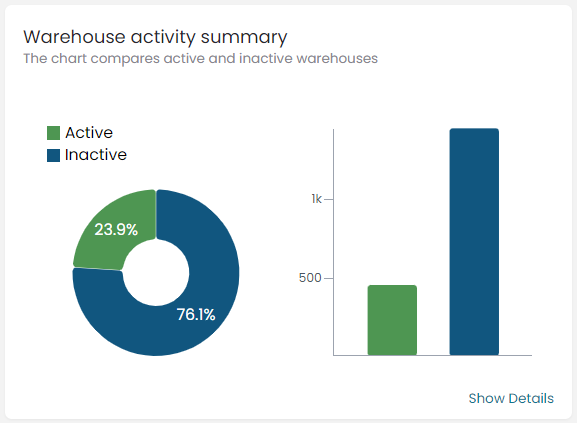
Warehouse activity summary
This chart uses color codes to compare the active and inactive warehouses in the selected accounts.
- Point to the active or inactive color on the pie or bar chart to display the number of active or inactive warehouses and their ratio.
- Click Show Details on the bottom right to open more details listing compute overview for the selected accounts.
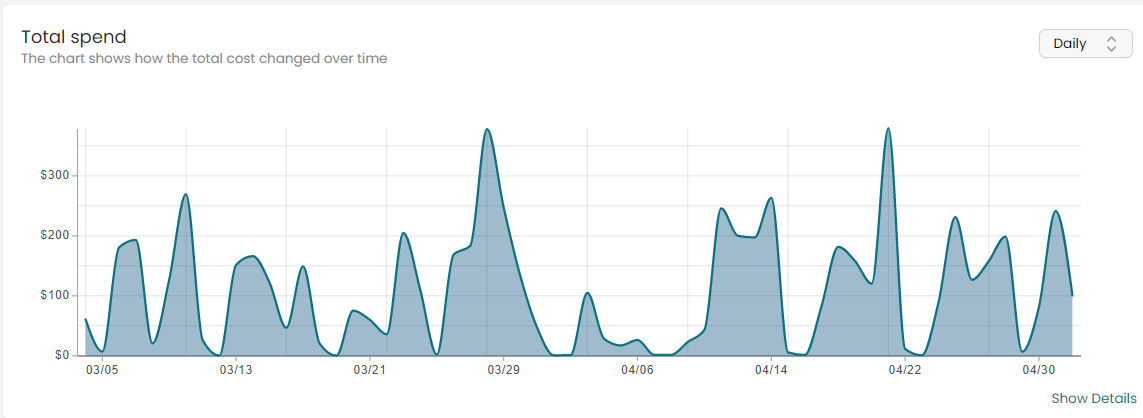
Total spend
This line chart shows how the accounts' total spend changes over the time specified in the date field on the top right of the page.
- On the top right, select whether to show the total spend evolution per week, day, or month.
- Point to the line at a specific point to display the total cost at that specific date and time.
- Click Show Details on the bottom right to open more details listing compute overview for the selected accounts.
Warehouse by size
This chart uses color codes to show the ratio of the different sizes of warehouses in the selected accounts.
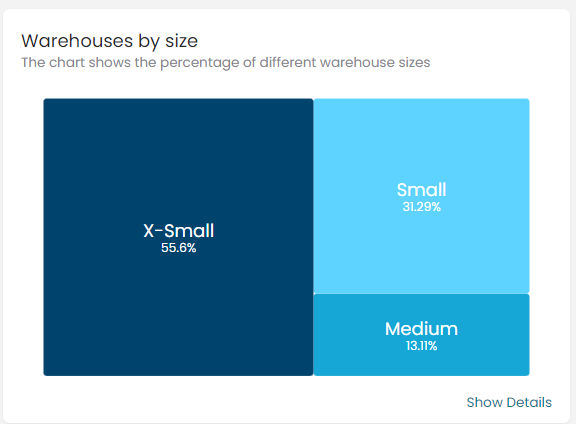
- Point to a specific size on the chart to display the number of warehouses in this size.
- Click Show Details on the bottom right to open more details listing compute overview for the selected accounts.