Cross-Accounts Spend Summary
Spendview for Snowflake, the free module from DataOps.live observability, generates valuable insights from the operational metadata scattered across several Snowflake accounts. It lets you monitor the spend drivers of your Snowflake accounts from a centralized view.
Accessing Spendview for Snowflake
Ensure that you have added the Snowflake accounts you want to monitor to the Snowflake Accounts page in Spendview for Snowflake.
- Open Spendview for Snowflake in your browser.
- Enter your username and password in the open form and click Sign in.
- On the menu bar, click Overview to open a centralized view of the Snowflake accounts' spending and utilization.
Your access to the icons on the left sidebar depends on your role in Spendview. See Access levels and roles for more information.
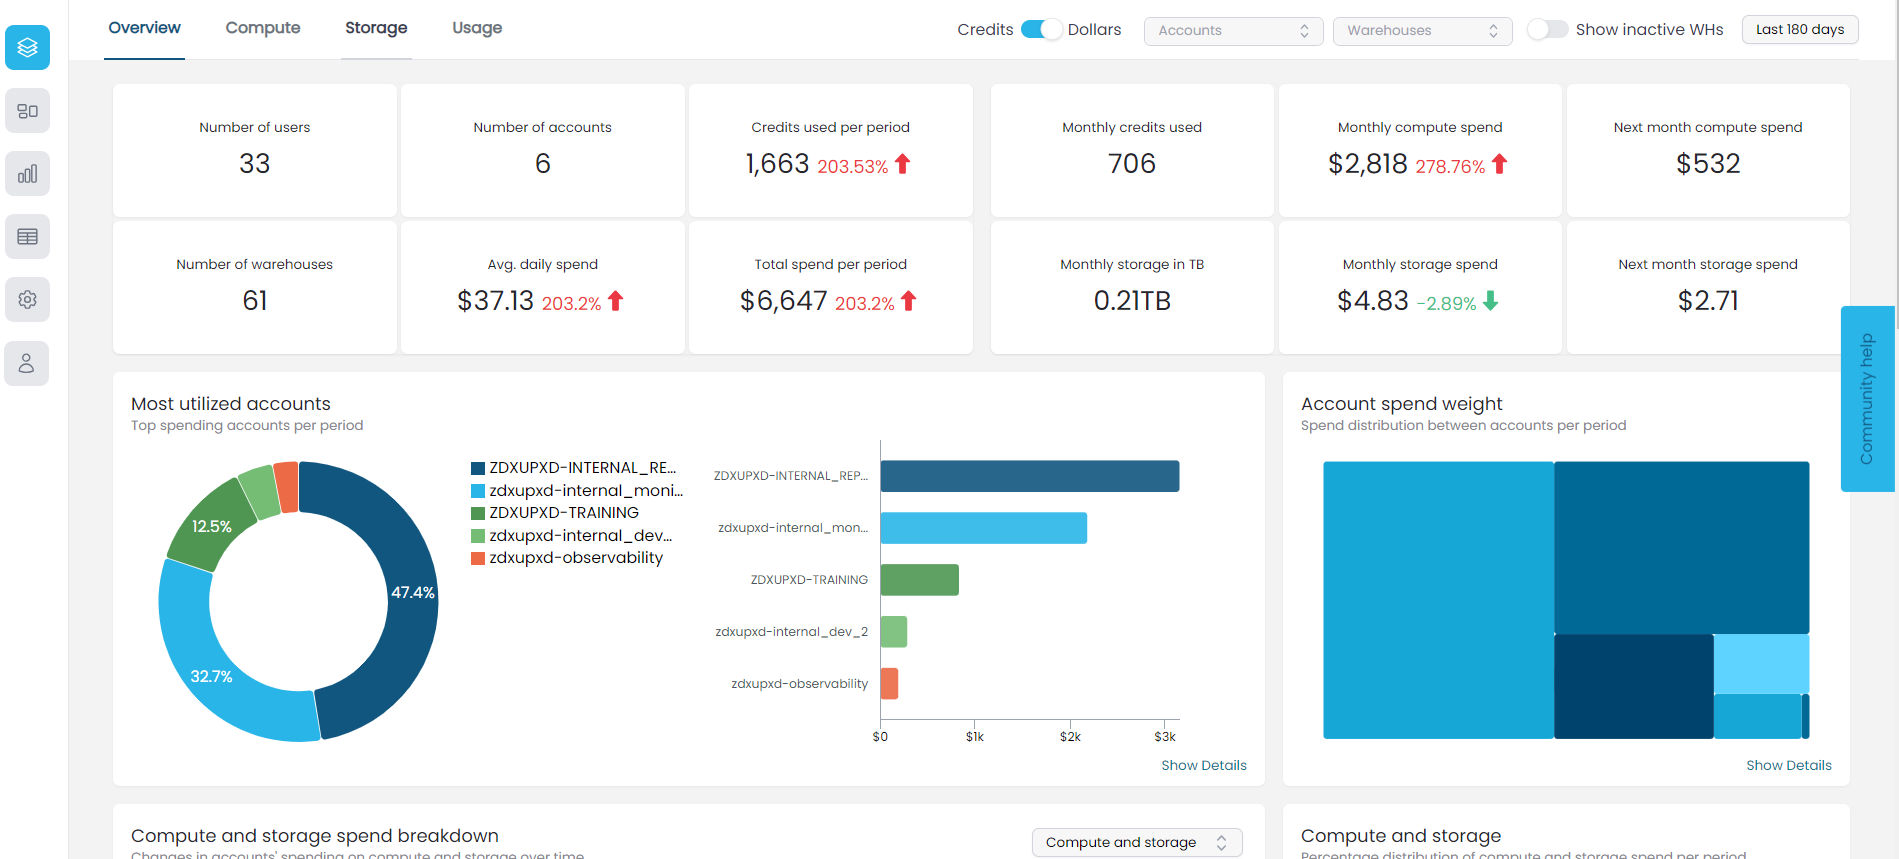
Visibility across accounts
From the Overview page, you can visualize and analyze several graphical metadata representations across your Snowflake accounts to drill down into operational cost-driver issues in seconds.
Use the fields on the top right to choose the time- and account-specific visualization options:
- To look at the overall cost of a specific set of accounts, click in the Account field and select the accounts you want to monitor. Click Clear selection at the bottom of the list to remove your filter.
- To look at the overall cost of a specific set of warehouses in the selected accounts, click in the Warehouses field and select the warehouses you want to monitor. Click Clear selection at the bottom of the list to remove your filter.
- To look at the overall cost during a specific date and time range, click in the date field and select the period you want to monitor.
- To show or hide all static warehouses in the selected accounts, toggle the Show inactive WHs option on or off.
Toggle on or off Credits or Dollars to show the credit score trends or the dollar score trends in the cross-account metrics.
In the cross-accounts summary metrics, you can learn about the following:
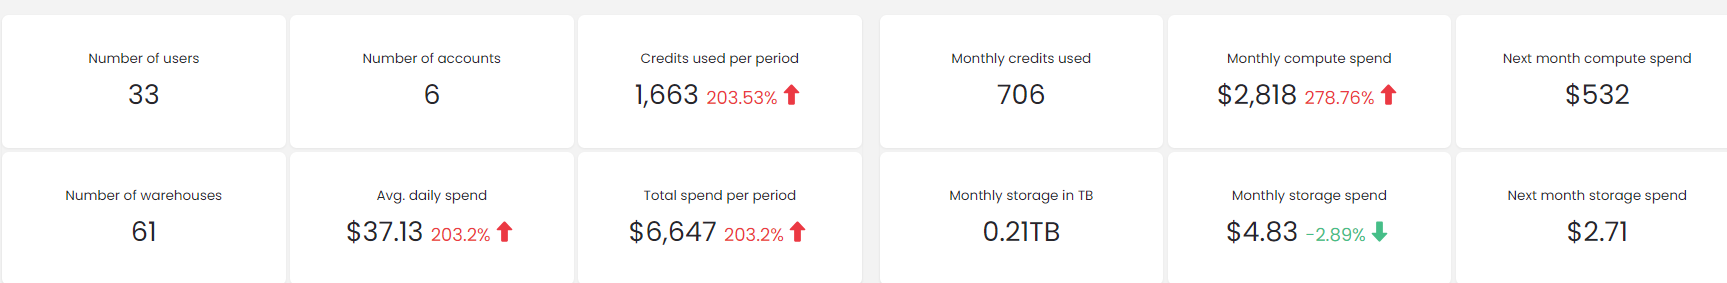
The percentage changes in the metrics will be red if the spend has increased and green if the spend has decreased. To get this rate, subtract the first period's spend — a month or a different period — from the second period's spend and divide that by the last spend's total. Multiply the result by 100, and you have the percentage.
| Name | Description |
|---|---|
| Numbers of users | Number of all users who have used the selected accounts over the chosen period |
| Number of warehouses | Number of warehouses used by the selected accounts over the chosen period |
| Number of accounts | Number of all the active accounts you are monitoring in Spendview for Snowflake |
| Avg. daily spend | Average dollars or credits spent per day for the selected accounts, billed over the chosen period (compute cost divided by the days set in the top right date field) |
| Credits used per period | Credits spent across the warehouses in the selected accounts over the chosen period |
| Total spend per period | Dollars or credits spent on compute and storage across the warehouses in the selected accounts over the chosen period |
| Monthly credits used | Last 30 days credits spent across the warehouses in the selected accounts |
| Monthly storage in TB | Last 30 days Terabyte spent on storage across the warehouses in the selected accounts |
| Monthly compute spend | Dollars or credits spent across the warehouses in the selected accounts over the last 30 days |
| Monthly storage spend | Dollars or credits spent on storage across the warehouses in the selected accounts over the last 30 days |
| Next month compute spend | Dollars or credits spent across the warehouses in the selected accounts over the next 30 days |
| Next month storage spend | Dollars or credits spent on storage for all the selected accounts over the next 30 days |
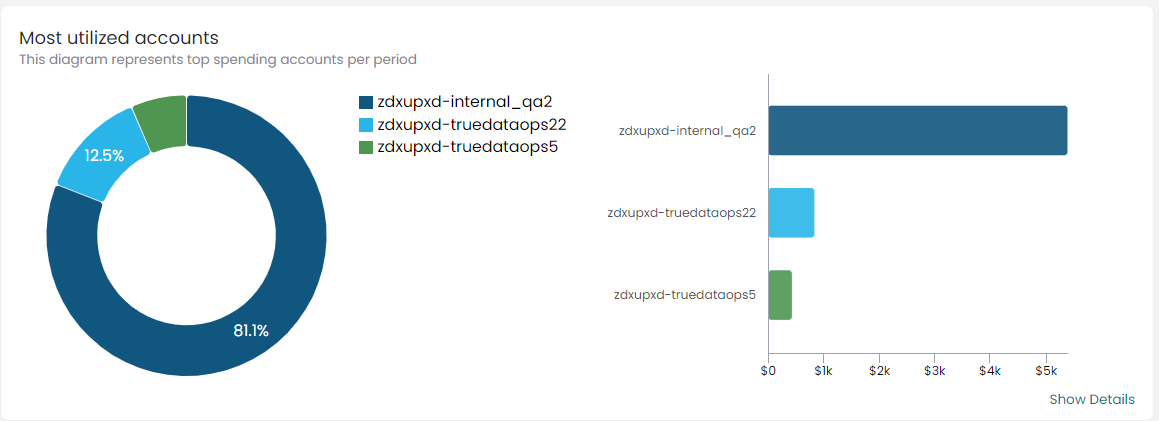
Most utilized accounts
This chart shows the accounts with the highest spend per period.
- Point to a specific color or account on the pie or bar chart to display the account name, usage percentage, and total cost.
- Click Show Details on the bottom right to open more details listing spend and usage overview for the selected accounts.
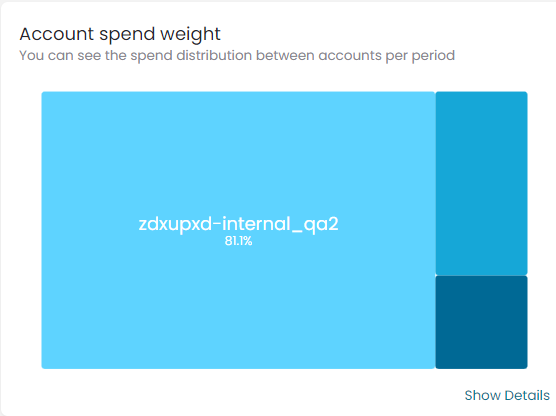
Account spend weight
This chart uses color codes to compare the spend per Snowflake account. It helps you see the spend distribution for the accounts visually and in seconds.
- Point to a specific color to display the account name, usage percentage, and spend.
- Click Show Details on the bottom right to open more details listing spend and usage overview for the selected accounts.
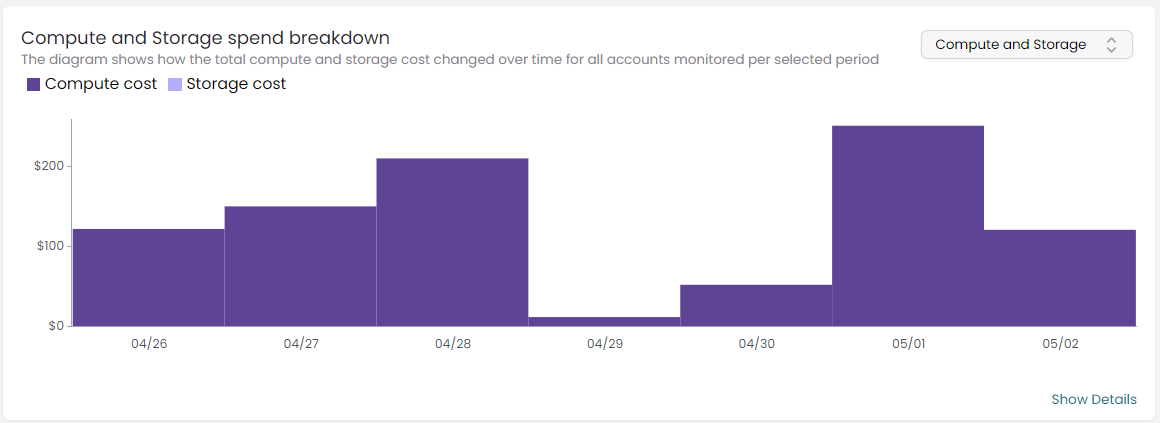
Compute and storage spend breakdown
This bar chart shows the changes in compute and/or storage spend in the selected accounts over the period chosen in the date field.
- On the top right, select what spend type to calculate and show.
- Point to a specific date on the bar chart to display the compute and/or storage cost at that specific date.
- Click Show Details on the bottom right to open more details listing spend and usage overview for the selected accounts.
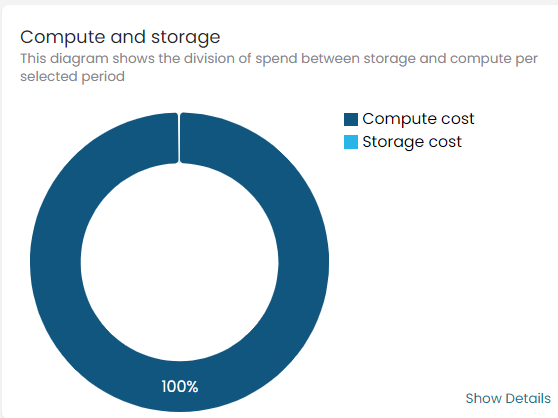
Compute and storage
This chart compares the compute and storage spend for the selected accounts over the period chosen in the date field.
- Point to a cost type color on the chart to display details about the cost type, percentage of usage, and spend.
- Click Show Details on the bottom right to open more details listing spend and usage overview for the selected accounts.
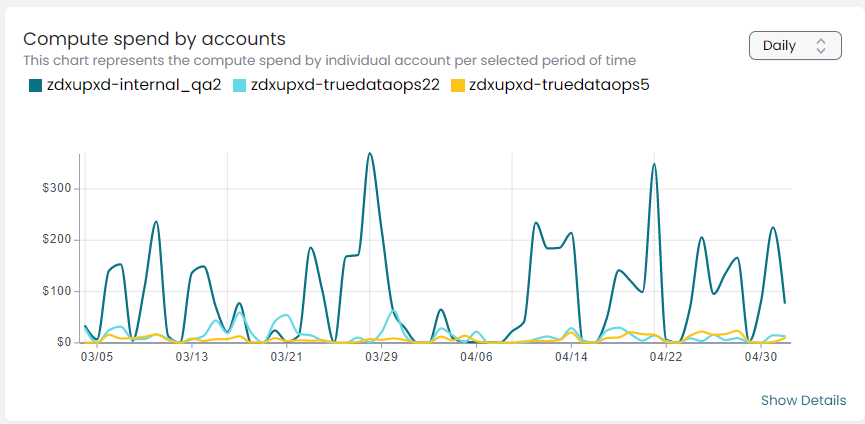
Compute spend by accounts
This line chart uses color codes to show the compute spend for the selected accounts.
- On the top right, select whether to show the compute spend per week, day, or month.
- Point to a specific account on the line chart to display the account name and the compute spend per the selected period.
- Click Show Details on the bottom right to open more details listing spend and usage overview for the selected accounts.
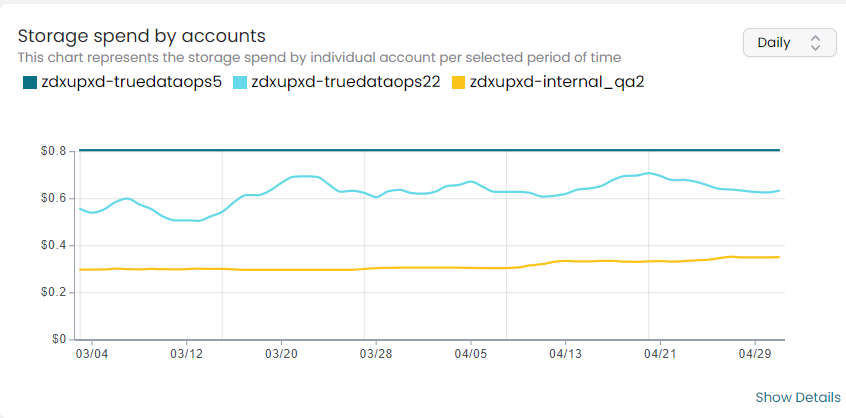
Storage spend by accounts
This line chart uses color codes to show the storage spend for the selected accounts.
- On the top right, select whether to show the storage spend per week, day, or month.
- Point to a specific account on the line chart to display the account name and the storage spend per the selected period.
- Click Show Details on the bottom right to open more details listing the spend and usage overview of the selected accounts.
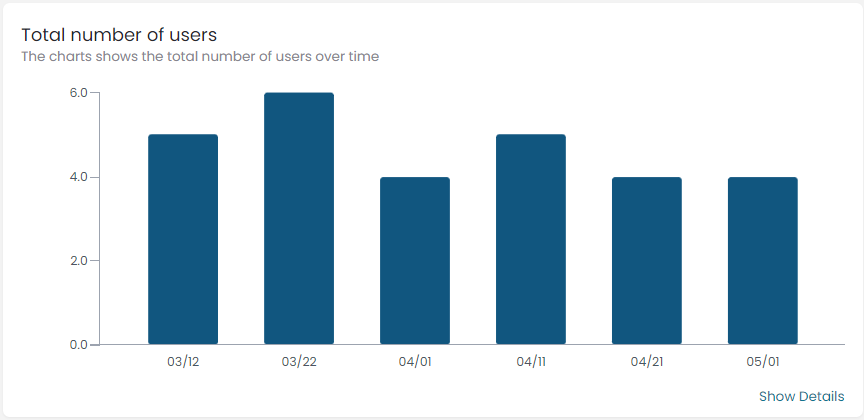
Total number of users
This bar chart shows the total number of accounts' users over the time specified in the date field.
- Point to a bar on the chart to display the total number of users for the selected account at that particular date.
- Click Show Details on the bottom right to open more details listing spend and usage overview of the selected accounts.
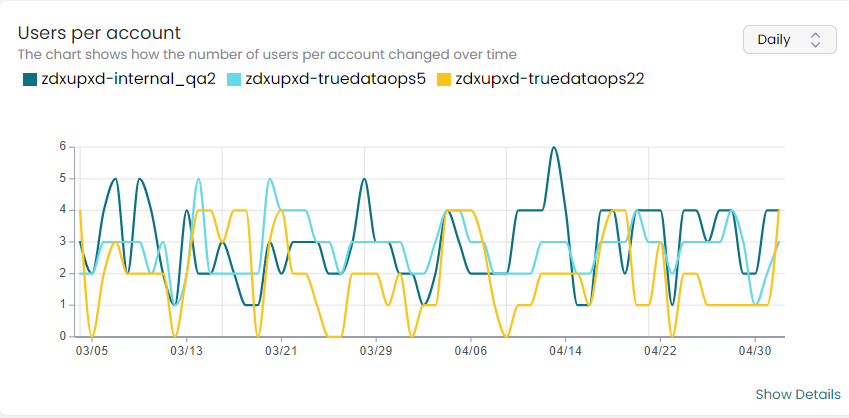
Users per account
This line chart uses color codes to show how the number of users per account changes over time.
- On the top right, select whether to show the users' number per week, day, or month.
- Point to a specific account on the line chart to display the account name and the number of users at a specific date.
- Click Show Details on the bottom right to open more details listing spend and usage overview of the selected accounts.